Very often important information is stored in related tables in a geodatabase. What happens if you want to symbolise a map using this data, or if you want to use this data as input into analysis tool and widgets? If your data resides in an Enterprise or Workgroup geodatabase you can simply create a view. It becomes a bit more tricky if your data is in a file geodatabase. This post will show you how to use Python to aggregate data in the related tables in a way that will allow you to join the information back to the primary table. These aggregated fields can then be used to symbolise map features and as input to analysis tools and widgets.
Consider the following scenario:
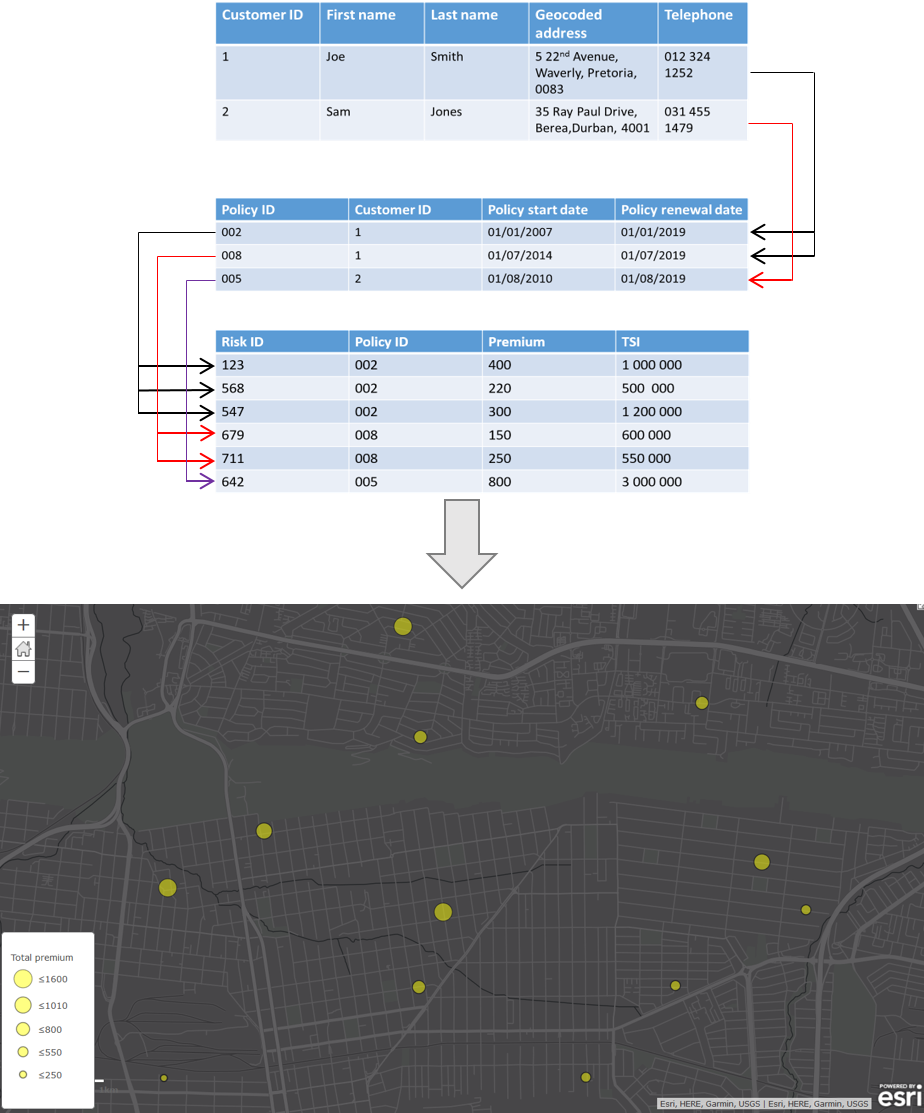
A customer table has a 1:M relationship with a policy table. The policy table has a 1:M relationship with a risk table. The premium and total sum insured (TSI) values in the risk table are important, as we want to perform spatial analysis using these values. We will therefore be aggregating the premium and total sum insured values per customer.
To perform the aggregations we will use the Python arcpy site package along with the Pandas library. ArcPy is a Python site package that provides a useful and productive way to perform geographic data analysis, data conversion, data management, and map automation with Python. Pandas is an open source library providing high-performance, easy-to-use data structures and data analysis tools for the Python programming language. The Pandas library comes with ArcGIS Pro so you will not need to worry about installing it separately if you have Pro installed. ArcPy comes with both ArcMap and ArcGIS Pro.
Step 1: Import arcpy and pandas
In an IDE of your choice, create a new python file. Import arcpy and pandas.
[python]
import arcpy
import pandas as pd
[/python]
Step 2: Set paths to data
[python]
# Paths to data
riskTable = r’D:\Projects\Clients.gdb\Risk’
policyTable = r’D:\Projects\Clients.gdb\Policy’
[/python]
Step 3: Convert geodatabase tables to Pandas DataFrames
We will create Pandas DataFrames for the Risk and Policy tables using only the necessary fields.
[python]
# Convert tables to pandas Dataframes
arr_risk = arcpy.da.TableToNumPyArray(riskTable,["RiskID","PolicyID","SumInsured","Premium"])
data_risk = pd.DataFrame(arr_risk,dtype=’double’)
arr_policy = arcpy.da.TableToNumPyArray(policyTable,["PolicyID","CustomerID"])
data_policy = pd.DataFrame(arr_policy)
[/python]
Step 4: Group data per policy
In this step, we need to sum the TSI and premium values per policy. To do this we can use the Pandas groupby functionality to create a new column with the summed values.
[python]
#Group data by sum insured
sumInsured_groups = data_risk.groupby("PolicyID")["SumInsured"].sum().reset_index(name="Sum insured total")
#Group data by premium
premium_groups = data_risk.groupby("PolicyID")["Premium"].sum().reset_index(name = "premium total")
[/python]
This will produce two new DataFrames with summed values per policy. The Dataframes in tabular format are as follows:
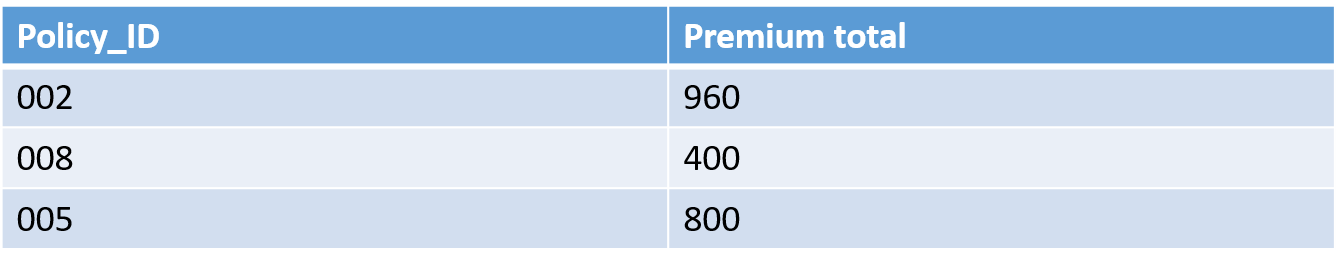
Total premiums per policy
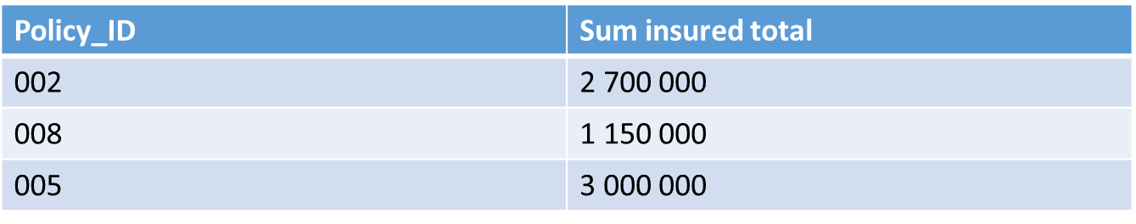
Total sum insured per policy
At this point we have three DataFrames: The grouped total sum insured DataFrame, the total premium DataFrame and the policy DataFrame. The next step is to merge the three DataFrames together so that we can determine the total values per customer.
Step 5: Merge policy DataFrames
Because we are merging three DataFrames, we need to perform two separate merges:
[python]
# Merge tables
customer_suminsured = pd.merge(data_policy,sumInsured_groups, how=’left’, on="PolicyID")
customer_totals = pd.merge(customer_suminsured,premium_groups,how="left", on=’PolicyID’)
[/python]
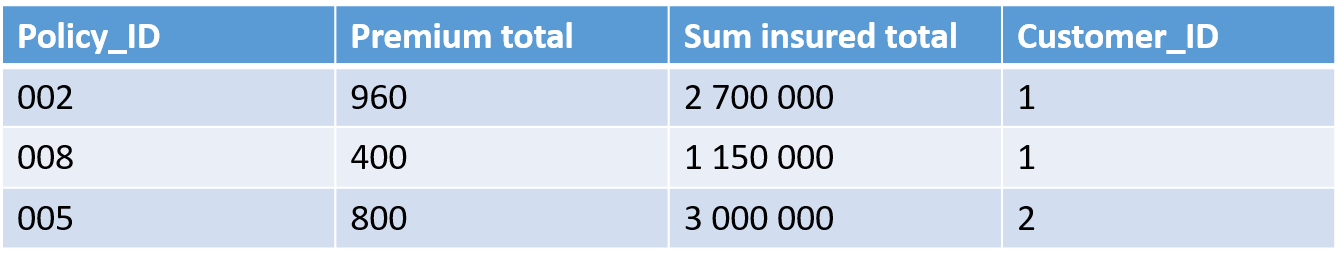
The resulting table looks similar to the following:
Step 6: Group data per customer
We will now group the total sum insured values and total premiums per customer:
[python]
# Group values per customer
# Group values per customer
customer_grouping_suminsured = customer_totals.groupby("CustomerID")["Sum insured total"].sum()\
.reset_index(name="Total sum insured")
customer_grouping_premium = customer_totals.groupby("CustomerID")["Premium total"].sum().\
reset_index(name="Total premium")
[/python]
This is the same process as step 4 except that we are grouping per customer instead of policy, and we are using the total sum values calculated in step 4. The resulting tables look similar to the following:
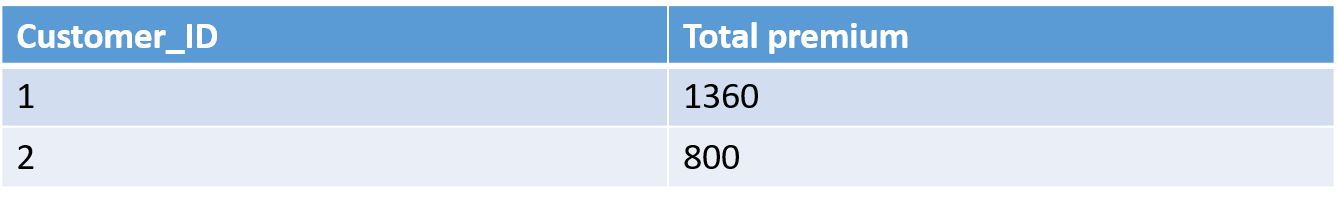
Total premium per customer
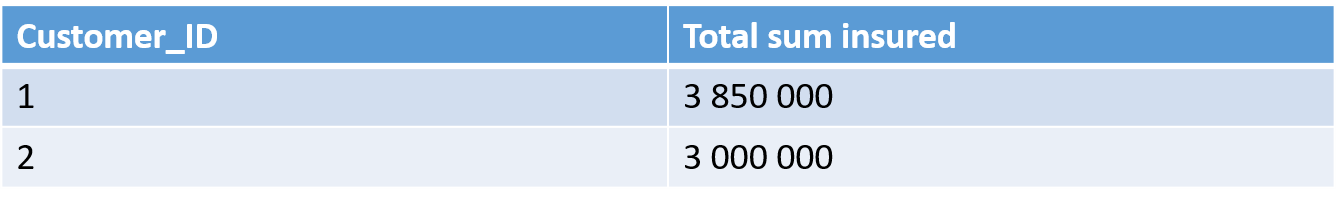
Total sum insured per customer
Step 7: Merge customer tables
We will now merge the two customer tables to create one final table showing the total sum insured and total premium for each customer.
[python]
# Merge customer tables
# Merge customer tables
customer_grouping = pd.merge(customer_grouping_suminsured, customer_grouping_premium, how="outer", on="CustomerID")
[/python]
The resulting table is as follows:
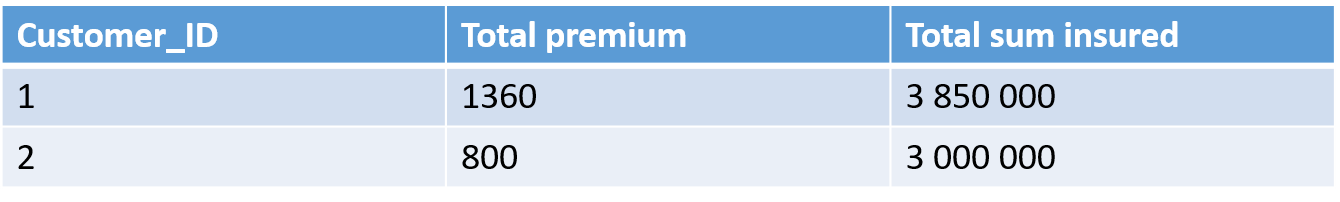
Total premium and sum insured values per customer
Step 8: Export DataFrame
You can now export the DataFrame with the customer totals to a wide range of formats. For example, to export the customer_grouping DataFrame to a csv, you would do the following:
[python]
customer_grouping.to_csv(r"D:\Projects\customer_totals.csv")
[/python]
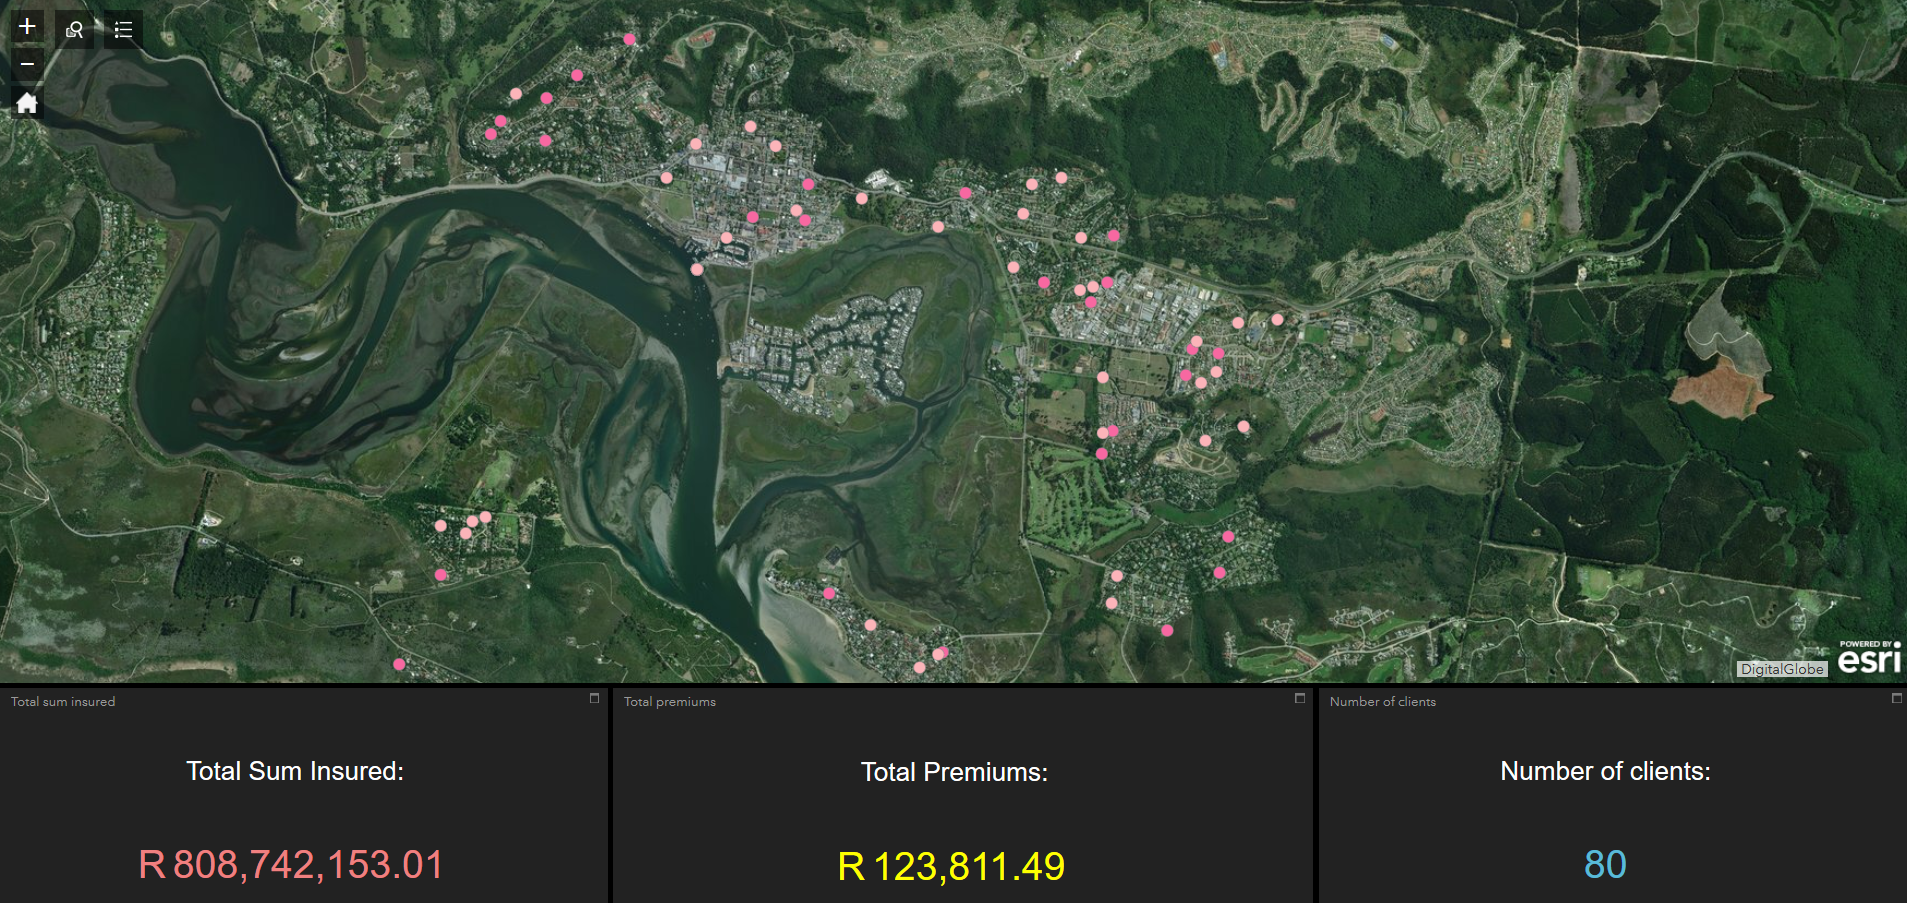
This output table can then be joined back to the primary customer table and used for mapping and spatial analysis as in the following example: