Cyclone Idai
-the mozambique floods 2019-
by Sean Cullen
On the 15th of March 2019, tropical cyclone Idai made landfall in Mozambique, accompanied by torrential rainstorms and floods. Idai is the second-deadliest tropical cyclone recorded in the South-West Indian Ocean basin, after the Mauritius cyclone in 1892.
When it comes to monitoring tropical cyclones and other natural disasters, satellite imagery can play a key roll in assessing the area before and after the phenomenon, assessing the extent of damage based on change or displacement. The one issue that we face when assessing the damage during or after a tropical storm is the cloud cover that accompanies the cyclone. Thanks to Synthetic Aperture Radar (SAR) on satellite platforms, we can acquire imagery of wide (large) areas to assess the effects of natural phenomenon, with limited impacts from clouds. SAR has the ability to penetrate clouds and observe the reflectance properties of the earth’s surface.
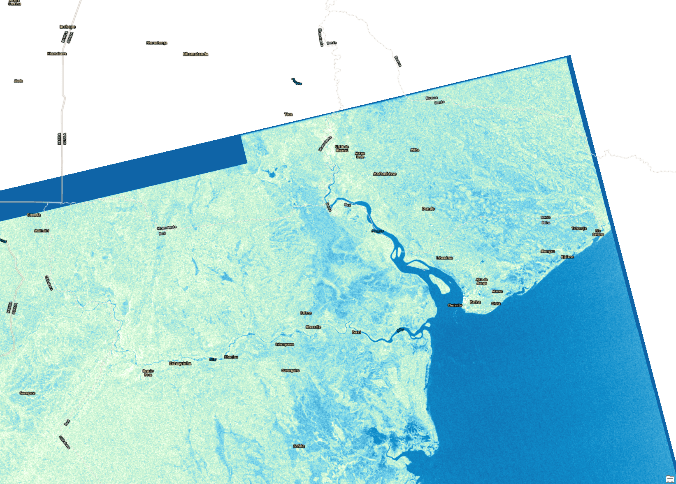
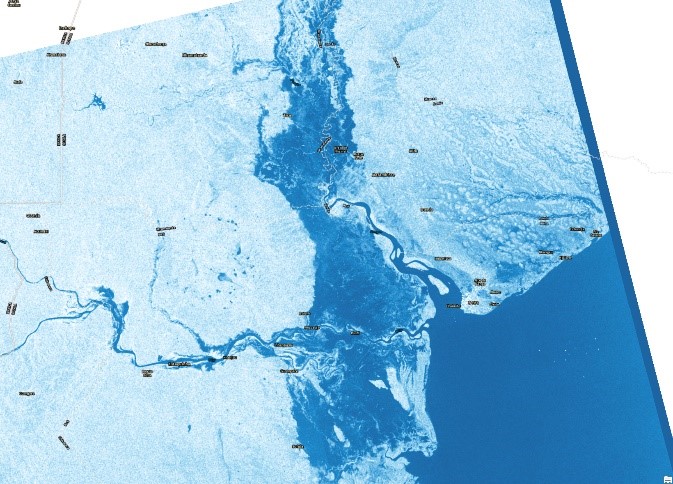
The images below show two SAR images being displayed with a Vertical-Horizontal polarization. This polarization is better suited for the monitoring of water and in this case highlight areas that are covered with water.
The first image was captured on the 13th of March 2019, two days before Idai made land fall, showing the earth surface reflectance properties. The darker shade of blue would indicate water body surfaces while the whiter shaded areas show other land surfaces. The second image is from the 19th of March 2019 and shows the same surface reflectance properties after the flooding had started, however there is a substantial area covered by water as indicated in darker blue.
This information is critical to disaster management teams as it will indicate what areas are covered with water and where suitable areas are to set up relief support, for example where to establish forward bases for helicopter operations. This data is freely and readily available to the public, with little processing needed to make basic maps using ArcGIS Pro. To download the data one can create an account for the Copernicus Open Access Hub and search through the available catalogue for Sentinel imagery. //scihub.copernicus.eu/dhus/#/home
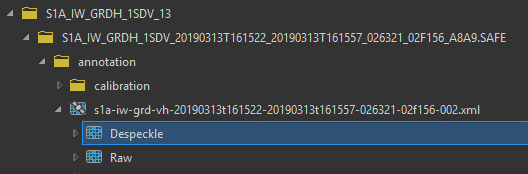
Sentinel-1 Interferometric Wide Swath (IW) Ground Range Detected (GRD) images are available in 10×10 meter resolution from the download. The images were exported from ArcGIS Pro at a 10m spatial resolution. It is very easy to load Sentinel-1 SAR data into ArcGIS Pro. This can be done by connecting to the folder, in your data catalogue, where your SAR data resides and expanding the Vertical Horizontal (VH) polarized metadata file. Once located you can drag and drop the Despeckle file into the map space and play around with the symbology.
Copernicus Sentinel data 2019, processed by ESA.
The SAR image from before Idai made landfall (13th of March) is available for download here: //scihub.copernicus.eu/dhus/odata/v1/Products(’51fbc445-fcba-44b5-8d55-307dcfc6475e’)/$value
The second image after Idai made landfall (19th of March) is available for download here: //scihub.copernicus.eu/dhus/odata/v1/Products(‘ba8aee87-7cfe-4661-b60c-37fbf7b2a6ce’)/$value